
You bought the Antminer S21. You plugged it in. The fans spun up, and you started earning sats. But are you actually making money? Or is your rig silently bleeding profit through overheating chips or inefficient power draws? Most solo miners and small farm operators treat their hardware like a black box. They check the pool dashboard once a day, see green numbers, and assume everything is fine. It’s not. Without proper monitoring, you’re flying blind.
The difference between a profitable month and a break-even one often comes down to spotting that one fan failure before the chip burns out, or catching a 5% drop in hashrate before it becomes a week-long outage. Effective monitoring isn't just about watching numbers; it's about actionable intelligence. In this guide, we’ll cut through the noise of crypto Twitter hype and look at the actual tools that help you track hash rate, temperature, and power usage effectively in 2026.
Why Your Dashboard Isn’t Enough
If you’re only looking at your mining pool’s website, you’re seeing lagged data. Pools calculate your contribution based on shares submitted over time. If your miner crashes at 2:00 AM, the pool might not reflect that loss in your daily average until the next payout cycle. Worse, pools don’t tell you *why* performance dropped. Was it network difficulty? A thermal throttle? A failing PSU?
Dedicated monitoring tools sit directly on your miner or your local network. They pull raw telemetry from the hardware. This allows you to see real-time changes. For instance, if your ambient temperature spikes because the AC unit failed, a good monitoring tool alerts you instantly. You can then decide whether to pause mining during peak electricity rates or fix the cooling issue immediately. According to industry data, effective monitoring can improve mining efficiency by 12-25% simply by catching these micro-inefficiencies early.
The Big Three Metrics: What Actually Matters
Not all metrics are created equal. While there are dozens of stats available, three stand out as critical for profitability and hardware longevity.
Hashrate: This is your computational power output, measured in terahashes per second (TH/s). Don’t just look at the total number. Look at the variance. A stable 200 TH/s is better than fluctuating between 180 and 220 TH/s, which indicates instability. If your hashrate drops more than 5% from the expected baseline, something is wrong. Dr. Adam Back, CEO of Blockstream, notes that such deviations are often the first sign of hardware degradation.
Temperature: ASICs run hot. Typically, between 60°C and 90°C. But "normal" depends on your environment. Monitoring tools should show you both the core temperature and the inlet/outlet air temperatures. High outlet temps with low inlet temps mean your heat exchangers are clogged. Consistently high core temps (>85°C) shorten the lifespan of your chips significantly. EZ Blockchain’s CTO Michael Dubrovsky argues that temperature monitoring is actually 37% more critical than hashrate tracking for long-term profitability because thermal stress causes nearly 70% of premature ASIC failures.
Power Usage: Measured in watts (W), but the real metric is efficiency in joules per terahash (J/TH). Modern miners like the Antminer S21 aim for ~15.5 J/TH. If your tool reports 18 J/TH, you’re losing money. Every watt counts when you’re running 24/7. However, be careful: most software estimates power draw. For true accuracy, you need smart PDUs (Power Distribution Units) that integrate with your monitoring software.
Top Tools for Solo Miners and Small Farms
Choosing the right tool depends on your scale and technical comfort level. Here’s how the current market leaders stack up.
| Tool | Best For | Key Feature | Cost Model | Platform |
|---|---|---|---|---|
| Hive OS | Small farms & tech-savvy solos | Deep hardware control, overclocking, remote management | Free (<5 devices), Paid Enterprise | Linux-based OS |
| Awesome Miner | Windows users, mixed fleets | Heat map visualization, supports 50+ clients | Free tier, Premium subscriptions | Windows App |
| Minerstat | Cloud-first, multi-site ops | Real-time alerts, automation, mobile app | Free (<10 miners), $9.99+/mo | Web/Mobile |
| Braiins OS+ | Firmware-level optimization | Predictive failure analytics, autotuning | Free (basic), Pro features paid | ASIC Firmware |
Hive OS is arguably the gold standard for those willing to flash their miners. It replaces the stock firmware with a Linux-based operating system designed specifically for mining. Why use it? Because it gives you granular control. You can adjust fan curves remotely, switch pools automatically based on profitability, and view detailed logs. The learning curve is steeper-you need to configure BIOS settings and network parameters-but the payoff is massive. Users report significant gains in uptime because Hive OS can auto-reboot miners that hang, a common issue with stock Bitmain firmware.
Awesome Miner takes a different approach. It runs on a Windows PC on your local network and scans for miners. Its standout feature is the heat map. Imagine walking into a server room where every bad miner glows red. That’s Awesome Miner’s interface. It’s incredibly intuitive for identifying underperforming units in a rack of twenty. It doesn’t require flashing firmware, so it’s safer for beginners who don’t want to void warranties. However, its dependency on a Windows machine means you need to keep that PC running 24/7.
Minerstat is built for the cloud-native era. If you have miners in different locations-say, one in your garage and one at a friend’s house-Minerstat aggregates them into one dashboard. The mobile app is excellent for getting push notifications when temperatures spike. Their integration with smart energy meters helps solve the power measurement accuracy problem, offering ±1.2% accuracy compared to the typical ±7.5% margin of software-only estimates.
The Hidden Trap: Power Measurement Accuracy
Here is a hard truth: your miner’s internal power sensor is lying to you. Or rather, it’s estimating. Most ASICs measure voltage and current at the board level, missing losses in the PSU and cables. Industry surveys show that reported power consumption can differ by more than 12% from actual wall-plug measurements taken via a PDU.
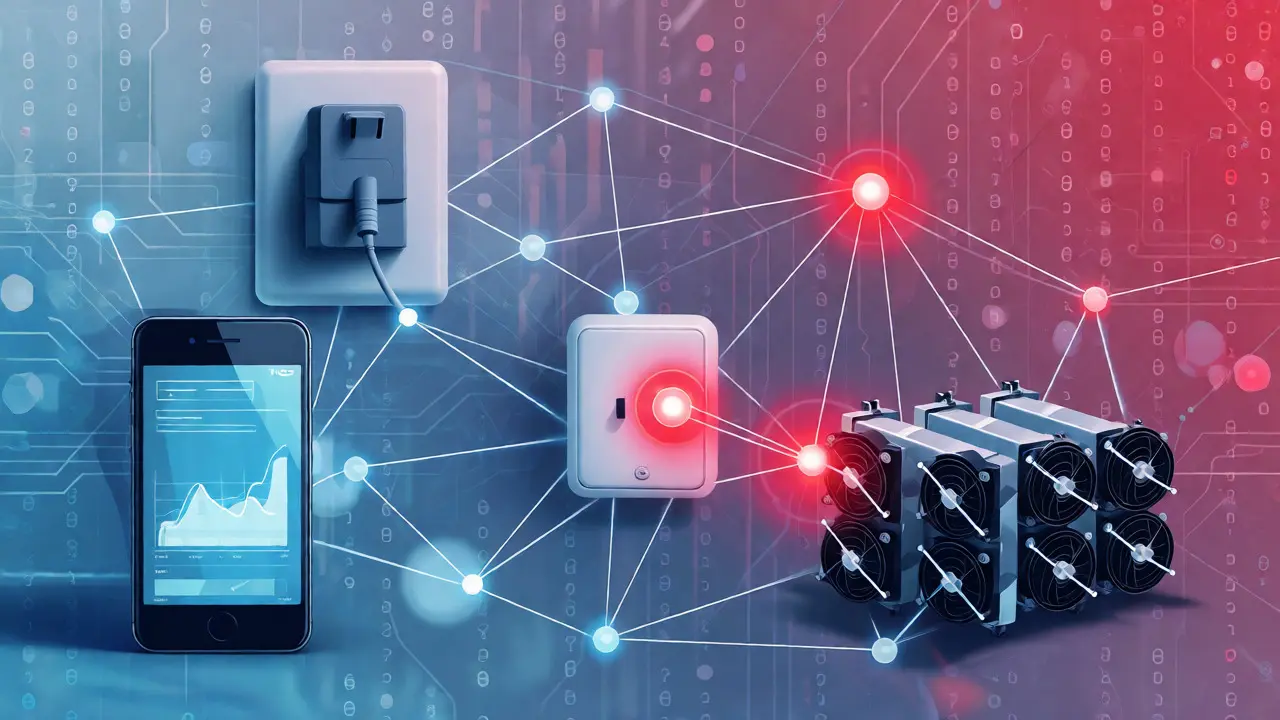
Why does this matter? If you think you’re using 3,000W but you’re actually using 3,400W, your electricity bill calculation is off by 13%. At industrial scales, this wipes out margins. To fix this, you need a setup that integrates external sensors. Tools like EZ Blockchain and advanced setups with Minerstat allow you to connect smart plugs or PDUs. These devices measure true power draw at the socket and feed that data back into the monitoring platform. Do not rely solely on the miner’s self-reported wattage for financial decisions.
Implementing a Monitoring Strategy
Don’t just install software and forget it. Set up a workflow.
- Step 1: Baseline Your Hardware. Run each miner alone for 24 hours. Record the average hashrate, temperature, and power draw. This is your "healthy" benchmark.
- Step 2: Set Alert Thresholds. Configure your tool to alert you if hashrate drops below 95% of baseline, or if core temp exceeds 85°C. Use SMS or email for critical alerts; don’t rely on app notifications that might get buried.
- Step 3: Automate Responses. If possible, link your monitoring to automation. For example, if ambient temps exceed 35°C, Hive OS can automatically lower the target frequency to prevent overheating, sacrificing a bit of hashrate to save the hardware.
- Step 4: Review Weekly. Look at trends. Is one miner consistently running hotter than others? It might need cleaning or repasting. Is power efficiency degrading over months? The capacitors might be aging.
For enterprise operations, this moves beyond individual rigs to fleet management. Companies managing hundreds of ASICs use platforms like EZ Blockchain or custom solutions to balance loads across sites based on real-time electricity pricing. During peak pricing hours, they might throttle non-critical miners, then ramp them up when rates drop. This dynamic response requires robust, low-latency monitoring infrastructure.
Common Pitfalls and How to Avoid Them
Even experienced miners make mistakes. The most common one is ignoring firmware updates. Manufacturers release patches that improve stability and efficiency. Sticking to an old version means leaving money on the table. Another pitfall is network configuration. Wi-Fi is unreliable for mining. Use Ethernet. Packet loss leads to stale shares and apparent hashrate drops that aren’t real.
Also, beware of "phantom" hashrate. Some tools report theoretical maxes rather than actual accepted work. Always cross-reference your local monitoring data with your pool’s accepted share count. If your local tool says 100 TH/s but your pool shows 80 TH/s accepted, investigate the discrepancy. It could be network latency or a pool-side issue.
Do I need to pay for monitoring software?
Not necessarily. Hive OS is free for up to five devices, and Awesome Miner offers a free tier for basic monitoring. However, if you manage more than ten miners or need advanced automation and historical data retention, paid plans (often starting around $10/month) provide significant value through reliability and support.
Which metric is most important for preventing hardware failure?
Temperature. While hashrate affects immediate revenue, sustained high temperatures cause irreversible damage to ASIC chips and capacitors. Thermal stress is responsible for the majority of premature miner failures. Prioritize cooling alerts over minor hashrate fluctuations.
Can I monitor multiple types of miners with one tool?
Yes. Tools like Awesome Miner and Minerstat support a wide variety of ASIC manufacturers, including Bitmain, MicroBT, and Innosilicon. They also support various algorithms, though Bitcoin mining (SHA-256) is the primary focus for most modern setups.
How accurate is software-measured power usage?
Software estimates are often inaccurate by 5-15%. They calculate power based on internal sensor readings which may miss PSU inefficiencies or cable losses. For precise billing and efficiency calculations, use a smart PDU or plug-in meter integrated with your monitoring platform.
What happens if my internet goes down?
Your miners will continue hashing locally, but they won't submit shares to the pool, meaning no rewards accumulate during the outage. Cloud-based monitoring tools (like Minerstat) will lose connection and stop reporting data. Local tools (like Awesome Miner) will still record data on your local PC, allowing you to review what happened once connectivity is restored.